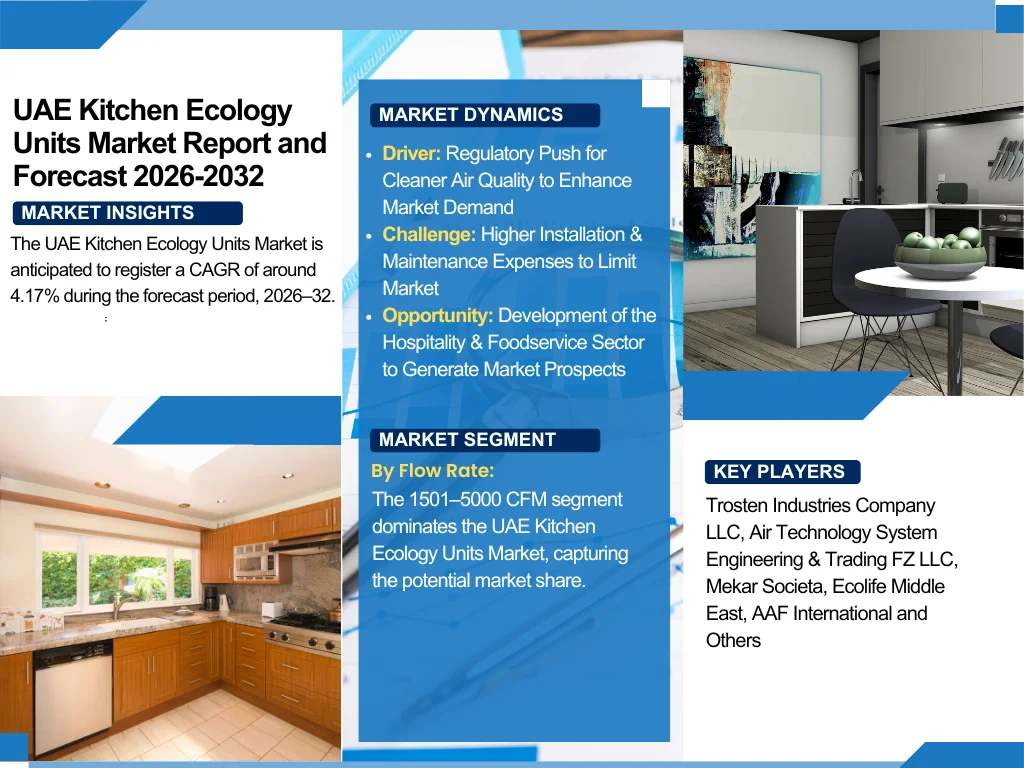
UAE Kitchen Ecology Units Market
Source: The Report Cube
Understand The Key Trends Shaping This Market
Download Free SampleUAE Kitchen Ecology Units Market Overview: Market Size & Forecast (2026–2032)
The UAE Kitchen Ecology Units Market is anticipated to register a CAGR of around 4.17% during the forecast period, 2026–32. The primary factors prompting the market outlook include surging urbanization, the expansion of the hospitality sector, and more stringent environmental laws. To preserve air quality & comply with health & safety guidelines, restaurants, hotels, and large commercial kitchens are increasingly employing advanced ecology units to decrease smoke, odor, and grease emissions.
Moreover, the UAE Kitchen Ecology Units Market product mainly consists of electrostatic precipitators, activated carbon filters, mechanical filters, and blowers, which are assimilated into kitchen exhaust systems to deliver effective air purification. Also, with increasing customer demand for healthier indoor environments & the UAE’s emphasis on sustainable construction, the acceptance of ecology units has expanded considerably. For insights into other kitchen-related investments, stakeholders may also explore the UAE Kitchen Cabinets Market to understand evolving design trends and consumer preferences. Further, in 2024, initiatives by Dubai Municipality introduced updated rules on air filtration standards for commercial kitchens, fueling market demand.
Furthermore, the UAE Kitchen Ecology Units Market progression is further supported by the nation’s flourishing foodservice industry, which continues to grow alongside tourism & real estate development. For understanding broader operational models in the region, the Saudi Arabia Cloud Kitchen Market Report offers a perspective on cloud kitchen adoption and innovations. Also, looking ahead, the demand for eco-friendly & high-efficiency units would remain strong, with innovation, government-backed sustainability initiatives, and compliance-driven acceptance ensuring a positive market outlook in the forthcoming years.
UAE Kitchen Ecology Units Market Dynamics
-
Driver: Regulatory Push for Cleaner Air Quality to Enhance Market Demand
A key driver for the UAE Kitchen Ecology Units Market expansion is the surging enforcement of regulations aiming indoor air quality & environmental sustainability. The government, mainly through Dubai Municipality & Abu Dhabi’s Environment Agency, has enforced stringent regulations on exhaust systems in commercial kitchens to minimize odor, grease, and particulate emissions. Further, this has augmented the acceptance of advanced kitchen ecology systems, directly affecting the market share. For technology and equipment trends influencing adoption, insights from the Asia-Pacific Kitchen Appliances Market Report can provide useful regional comparisons.
-
Challenge: Higher Installation & Maintenance Expenses to Limit Market Growth
One of the primary challenges across the UAE Kitchen Ecology Units Market is the high price of installation & ongoing maintenance. Also, ecology units need specialized design, high-quality filters, and periodic servicing, which surges operational expenses for smaller restaurants & food outlets. Further, while big hotels & international chains can house these costs, small- & medium-sized enterprises might hesitate to adopt advanced systems, affecting the overall revenue of the UAE Kitchen Ecology Units Market.

Understand The Key Trends Shaping This Market
Get Sample-
Opportunity: Development of the Hospitality & Foodservice Sector to Generate Market Prospects
The UAE’s hospitality and foodservice industry is expanding rapidly due to tourism growth, large-scale events, and the influx of international F&B brands. This presents a significant opportunity for the UAE Kitchen Ecology Units Market Report. As global hotel chains and premium restaurants establish operations in Dubai, Abu Dhabi, and Sharjah, demand for reliable ecology units is expected to rise. The opportunity is further magnified by the government’s push for sustainable tourism and green building certifications, where kitchen ecology units play a vital role.
-
Trend: Rising Adoption of Energy-Efficient & Smart Systems to be Trending
A prominent trend is the increasing preference for technically advanced & energy-efficient kitchen ecology systems. Producers are launching smart units with IoT-enabled monitoring that permits real-time tracking of airflow, grease build-up, and filter performance. This minimizes energy consumption, lengthens product life, and enhances efficacy. Also, the trend aligns with the UAE’s sustainability targets & makes the UAE Kitchen Ecology Units Market a technology-driven industry in the future years, with intelligent solutions replacing traditional exhaust systems.
UAE Kitchen Ecology Units Market Segmentation
By Flow Rate:
- Up to 600 CFM
- 601–1500 CFM
- 1501–5000 CFM
- 5001–25000 CFM
- Others
The 1501–5000 CFM segment dominates the UAE Kitchen Ecology Units Market, capturing the potential market share. As the segment caters to the majority of medium- to large-scale restaurants & commercial kitchens in the UAE, it is foreseen to be one of the foremost flow rates. Also, these systems offer an optimal balance between performance & efficacy, ensuring compliance with air quality standards while addressing heavy cooking loads in urban hospitality hubs such as Dubai & Abu Dhabi.
By Component:
- Mechanical Filter
- Electrostatic Precipitator (Pre-filtration, Fine Filtration, Odor Removal Section)
- Activated Carbon Filters
- Blower
- Others
The Electrostatic Precipitator segment holds the largest share of the UAE Kitchen Ecology Units Market. This is owing to its ability to capture fine particles and grease at high-efficiency levels, ensuring greater air purification. Also, widely accepted across hotels & large food chains, these systems support odor removal & compliance with environmental standards. Moreover, their resilience, adaptability to heavy-duty applications, and effectiveness in meeting the UAE’s sustainability guidelines make them the dominant choice.
UAE Kitchen Ecology Units Market: Recent Developments (2025)
- Trosten Industries Company LLC introduced a novel line of energy-efficient kitchen ecology units with multi-stage electrostatic filtration systems tailored for the UAE’s premium hospitality industry.
- Air Technology System Engineering & Trading FZ LLC launched smart IoT-enabled ecology units that offer real-time monitoring of air quality & maintenance alerts, improving operational efficiency for commercial kitchens.
Key Takeaways of the UAE Kitchen Ecology Units Market (2026–32)
- The UAE Kitchen Ecology Units Market is presumed to develop at a CAGR of about 4.17% between 2026–32
- The 1501–5000 CFM flow rate segment dominates the market’s demand graph.
- Electrostatic Precipitators led by component share
- The market growth is driven by regulatory compliance & hospitality expansion across the UAE.
- The surging adoption of smart & energy-efficient kitchen ecology units to encourage market development.
UAE Kitchen Ecology Units Market: Conclusion & Future Outlook (2032)
Through 2032, the UAE Kitchen Ecology Units Market is predicted to sustain positive growth, instigated by regulatory standards, smart kitchen technologies, and the nation’s growing hospitality sector. Furthermore, with the mounting adoption of eco-friendly & energy-efficient systems, the industry would continue to progress. Also, improved sustainability initiatives & innovation-led designs would further reinforce the UAE Kitchen Ecology Units Market size & ensure long-term opportunities in the following years.
What Does Our UAE Kitchen Ecology Units Market Research Study Entail?
- The UAE Kitchen Ecology Units Market Research Report highlights the forecast growth rate (CAGR) by anticipating the market size and share.
- The market analysis puts light upon the primary industry trends, driving aspects, potential opportunities, growth challenges, and other major factors.
- The UAE Kitchen Ecology Units Market Research Report entails details about the most critical shifts in market share in the prominent regions.
- Considering the statistics & the developments by the primary market competitors, our report also strives to demonstrate the most sought-after strategies of the key players.
Table of Contents
- Introduction
- Objective of the study
- Product Definition
- Market Segmentation
- Study Variables
- Research Methodology
- Secondary Data Points
- Companies Interviewed
- Primary Data Points
- Break Down of Primary Interviews
- Secondary Data Points
- Executive Summary
- Market Dynamics
- Drivers
- Challenges
- Opportunity Assessment
- Recent Trends and Developments
- Policy and Regulatory Landscape
- UAE Kitchen Ecology Units Market Overview (2020-2032)
- Market Size, By Value (in USD Billions)
- Market Share, By Flow Rate
- Up to 600 CFM
- 601–1500 CFM
- 1501–5000 CFM
- 5001–25000 CFM
- Others
- Market Share, By Component
- Mechanical Filter
- Electrostatic Precipitator (Pre-filtration, Fine Filtration, Odor Removal Section)
- Activated Carbon Filters
- Blower
- Others
- Market Share, By End Use
- Residential
- Commercial Establishment
- Quick Service Restaurant (QSR)
- Hotel
- Industrial
- School and Universities
- Healthcare
- Others
- Market Share, By Region
- Dubai
- Abu Dhabi
- Sharjah
- Others
- Market Share, By Competitors
- Competition Characteristics
- Revenue Shares
- UAE Up to 600 CFM Kitchen Ecology Units Market Overview, 2020-2032F
- By Value (USD Million)
- By Component- Market Size & Forecast 2019-2030, USD Million
- By End Use- Market Size & Forecast 2019-2030, USD Million
- UAE 601–1500 CFM Kitchen Ecology Units Market Overview, 2020-2032F
- By Value (USD Million)
- By Component- Market Size & Forecast 2019-2030, USD Million
- By End Use- Market Size & Forecast 2019-2030, USD Million
- UAE 1501–5000 CFM Kitchen Ecology Units Market Overview, 2020-2032F
- By Value (USD Million)
- By Component- Market Size & Forecast 2019-2030, USD Million
- By End Use- Market Size & Forecast 2019-2030, USD Million
- UAE 5001–25000 CFM Kitchen Ecology Units Market Overview, 2020-2032F
- By Value (USD Million)
- By Component- Market Size & Forecast 2019-2030, USD Million
- By End Use- Market Size & Forecast 2019-2030, USD Million
- UAE Others Kitchen Ecology Units Market Overview, 2020-2032F
- By Value (USD Million)
- By Component- Market Size & Forecast 2019-2030, USD Million
- By End Use- Market Size & Forecast 2019-2030, USD Million
- Competitive Outlook (Company Profile - Partila List)
- Trosten Industries Company LLC
- Company Overview
- Business Segments
- Strategic Alliances/Partnerships
- Recent Developments
- Air Technology System Engineering & Trading FZ LLC
- Company Overview
- Business Segments
- Strategic Alliances/Partnerships
- Recent Developments
- Mekar Societa
- Company Overview
- Business Segments
- Strategic Alliances/Partnerships
- Recent Developments
- Ecolife Middle East
- Company Overview
- Business Segments
- Strategic Alliances/Partnerships
- Recent Developments
- AAF International
- Company Overview
- Business Segments
- Strategic Alliances/Partnerships
- Recent Developments
- Others
- Trosten Industries Company LLC
- Contact Us & Disclaimer
List of Figure
-
Figure 1: UAE Kitchen Ecology Units—Study Workflow & Methodology Framework
-
Figure 2: Data Sources Split—Primary vs. Secondary (% of inputs)
-
Figure 3: Companies Interviewed—By Role & Value Chain Position
-
Figure 4: Primary Interviews—Respondent Breakdown (Function, Seniority, Region)
-
Figure 5: Product Definition—Typical Kitchen Ecology Unit Architecture & Airflow Path
-
Figure 6: Market Segmentation Schema (Flow Rate, Component, End Use, Region)
-
Figure 7: Study Variables & KPI Map (Value, Volume, CAGR, Penetration)
-
Figure 8: UAE Kitchen Ecology Units Market Size, 2020–2032F (USD Billions)
-
Figure 9: Year-on-Year Growth & CAGR, 2020–2032F (%)
-
Figure 10: Revenue Contribution by Customer Type (Residential vs. Non-Residential), 2020–2032F (%)
-
Figure 11: Installed Base vs. New Installations Mix, 2020–2032F (% of value)
-
Figure 12: Market Drivers—Impact vs. Time Horizon Matrix
-
Figure 13: Market Challenges—Severity vs. Likelihood Matrix
-
Figure 14: Opportunity Assessment—Attractiveness Map by Segment
-
Figure 15: Recent Trends & Technology Shifts (Electrostatic, Carbon, Smart Controls)
-
Figure 16: Regulatory Timeline & Key Compliance Requirements—UAE (Summary View)
-
Figure 17: Market Share by Flow Rate, 2020–2032F (% of value)
-
Figure 18: Flow Rate Segment—Up to 600 CFM Share, 2020–2032F (%)
-
Figure 19: Flow Rate Segment—601–1500 CFM Share, 2020–2032F (%)
-
Figure 20: Flow Rate Segment—1501–5000 CFM Share, 2020–2032F (%)
-
Figure 21: Flow Rate Segment—5001–25,000 CFM Share, 2020–2032F (%)
-
Figure 22: Flow Rate Segment—Others Share, 2020–2032F (%)
-
Figure 23: Market Share by Component, 2020–2032F (% of value)
-
Figure 24: Mechanical Filter—Revenue Share, 2020–2032F (%)
-
Figure 25: Electrostatic Precipitator—Sectional Cost Split (Pre-, Fine-, Odor Removal), Current Year (%)
-
Figure 26: Activated Carbon Filters—Adoption Trend, 2020–2032F (% of projects)
-
Figure 27: Blower Systems—Revenue Share & Efficiency Trend, 2020–2032F (%)
-
Figure 28: Other Components—Share & Notes, 2020–2032F (%)
-
Figure 29: Market Share by End Use, 2020–2032F (% of value)
-
Figure 30: Residential—Market Share & Growth, 2020–2032F (%)
-
Figure 31: Commercial Establishments—Market Share & Growth, 2020–2032F (%)
-
Figure 32: Quick Service Restaurants (QSR)—Market Share & Growth, 2020–2032F (%)
-
Figure 33: Hotels—Market Share & Growth, 2020–2032F (%)
-
Figure 34: Industrial—Market Share & Growth, 2020–2032F (%)
-
Figure 35: Schools & Universities—Market Share & Growth, 2020–2032F (%)
-
Figure 36: Healthcare—Market Share & Growth, 2020–2032F (%)
-
Figure 37: Other End Uses—Market Share & Growth, 2020–2032F (%)
-
Figure 38: Regional Market Share—Dubai, Abu Dhabi, Sharjah, Others; 2020–2032F (%)
-
Figure 39: Dubai—Market Size Trend, 2020–2032F (USD Millions)
-
Figure 40: Abu Dhabi—Market Size Trend, 2020–2032F (USD Millions)
-
Figure 41: Sharjah—Market Size Trend, 2020–2032F (USD Millions)
-
Figure 42: Other Emirates—Market Size Trend, 2020–2032F (USD Millions)
-
Figure 43: Competitive Landscape—Market Structure & Characteristics (Herfindahl Index, #Players)
-
Figure 44: Top Competitors—Revenue Shares (Latest Year, %)
-
Figure 45: Price-Positioning vs. Feature-Breadth Map (Key Vendors)
-
Figure 46: Up to 600 CFM—Market Size, 2020–2032F (USD Millions)
-
Figure 47: Up to 600 CFM—Component Split, 2020–2032F (% of value)
-
Figure 48: Up to 600 CFM—End-Use Split, 2020–2032F (% of value)
-
Figure 49: 601–1500 CFM—Market Size, 2020–2032F (USD Millions)
-
Figure 50: 601–1500 CFM—Component Split, 2020–2032F (% of value)
-
Figure 51: 601–1500 CFM—End-Use Split, 2020–2032F (% of value)
-
Figure 52: 1501–5000 CFM—Market Size, 2020–2032F (USD Millions)
-
Figure 53: 1501–5000 CFM—Component Split, 2020–2032F (% of value)
-
Figure 54: 1501–5000 CFM—End-Use Split, 2020–2032F (% of value)
-
Figure 55: 5001–25,000 CFM—Market Size, 2020–2032F (USD Millions)
-
Figure 56: 5001–25,000 CFM—Component Split, 2020–2032F (% of value)
-
Figure 57: 5001–25,000 CFM—End-Use Split, 2020–2032F (% of value)
-
Figure 58: Other Flow Rates—Market Size, 2020–2032F (USD Millions)
-
Figure 59: Other Flow Rates—Component Split, 2020–2032F (% of value)
-
Figure 60: Other Flow Rates—End-Use Split, 2020–2032F (% of value)
-
Figure 61: Company Profiles—Trosten Industries: Business Segments & Revenue Mix (%)
-
Figure 62: Air Technology System Engg. & Trading: Business Segments & Revenue Mix (%)
-
Figure 63: Mekar Societa: Business Segments & Revenue Mix (%)
-
Figure 64: Ecolife Middle East: Business Segments & Revenue Mix (%)
-
Figure 65: AAF International: Business Segments & Revenue Mix (%)
-
Figure 66: Strategic Alliances/Partnerships—Network Map (Selected Players)
-
Figure 67: Recent Developments—Timeline of Key Announcements (Top Players)
-
Figure 68: Sensitivity Analysis—Market Size vs. Key Assumptions (Spider Chart)
-
Figure 69: Scenario Comparison—Base, Optimistic, Conservative (USD Billions, 2032F)
-
Figure 70: Report Scope, Contact & Disclaimer—Coverage Summary
List of Table
-
Table 1: Objective of the Study—Scope and Coverage
-
Table 2: Product Definition—Functional Description of Kitchen Ecology Units
-
Table 3: Market Segmentation Framework (By Flow Rate, Component, End Use, Region)
-
Table 4: Study Variables and Measurement Parameters
-
Table 5: Secondary Data Sources Utilized (Databases, Reports, Journals)
-
Table 6: Companies Interviewed—By Geography and Role in Value Chain
-
Table 7: Primary Interviews—Breakdown by Function, Seniority, and End Use
-
Table 8: Executive Summary—Snapshot of Market Size, Growth & Key Insights
-
Table 9: Market Drivers—Qualitative Assessment
-
Table 10: Market Challenges—Qualitative Assessment
-
Table 11: Opportunity Assessment—Segment-Level Attractiveness
-
Table 12: Recent Trends and Developments—Technology & Business Model Innovations
-
Table 13: Policy and Regulatory Landscape—Key UAE Regulations Relevant to Kitchen Ecology Units
-
Table 14: UAE Kitchen Ecology Units Market Size, 2020–2032F (USD Billions)
-
Table 15: Market Share by Flow Rate, 2020–2032F (%)
-
Table 16: Market Share by Component, 2020–2032F (%)
-
Table 17: Market Share by End Use, 2020–2032F (%)
-
Table 18: Market Share by Region, 2020–2032F (%)
-
Table 19: Market Share by Competitors—Revenue Share (Latest Year, %)
-
Table 20: UAE Up to 600 CFM Market Size, 2020–2032F (USD Millions)
-
Table 21: Up to 600 CFM—Market Size by Component, 2019–2030 (USD Millions)
-
Table 22: Up to 600 CFM—Market Size by End Use, 2019–2030 (USD Millions)
-
Table 23: UAE 601–1500 CFM Market Size, 2020–2032F (USD Millions)
-
Table 24: 601–1500 CFM—Market Size by Component, 2019–2030 (USD Millions)
-
Table 25: 601–1500 CFM—Market Size by End Use, 2019–2030 (USD Millions)
-
Table 26: UAE 1501–5000 CFM Market Size, 2020–2032F (USD Millions)
-
Table 27: 1501–5000 CFM—Market Size by Component, 2019–2030 (USD Millions)
-
Table 28: 1501–5000 CFM—Market Size by End Use, 2019–2030 (USD Millions)
-
Table 29: UAE 5001–25,000 CFM Market Size, 2020–2032F (USD Millions)
-
Table 30: 5001–25,000 CFM—Market Size by Component, 2019–2030 (USD Millions)
-
Table 31: 5001–25,000 CFM—Market Size by End Use, 2019–2030 (USD Millions)
-
Table 32: UAE Others Flow Rate Market Size, 2020–2032F (USD Millions)
-
Table 33: Others—Market Size by Component, 2019–2030 (USD Millions)
-
Table 34: Others—Market Size by End Use, 2019–2030 (USD Millions)
-
Table 35: Competitive Landscape—Top Vendors and Key Characteristics
-
Table 36: Trosten Industries Company LLC—Company Overview & Segmental Revenue
-
Table 37: Air Technology System Engineering & Trading FZ LLC—Company Overview & Segmental Revenue
-
Table 38: Mekar Societa—Company Overview & Segmental Revenue
-
Table 39: Ecolife Middle East—Company Overview & Segmental Revenue
-
Table 40: AAF International—Company Overview & Segmental Revenue
-
Table 41: Summary of Other Key Players
-
Table 42: Strategic Alliances/Partnerships by Key Companies
-
Table 43: Recent Developments by Leading Players
-
Table 44: Sensitivity Analysis—Impact of Key Assumptions on Market Forecast
-
Table 45: Scenario Analysis—Base, Optimistic, and Conservative Case, 2032F (USD Billions)
Top Key Players & Market Share Outlook
- Trosten Industries Company LLC
- Air Technology System Engineering & Trading FZ LLC
- Mekar Societa
- Ecolife Middle East
- AAF International
- Others
Frequently Asked Questions


