




Build Your Custom Market Intelligence Report
Customize Your ReportU.S. Trading Cards Market Key Takeaways
- Market valued at USD 14.43 billion in 2026, reflecting sustained collector and gaming demand nationwide.
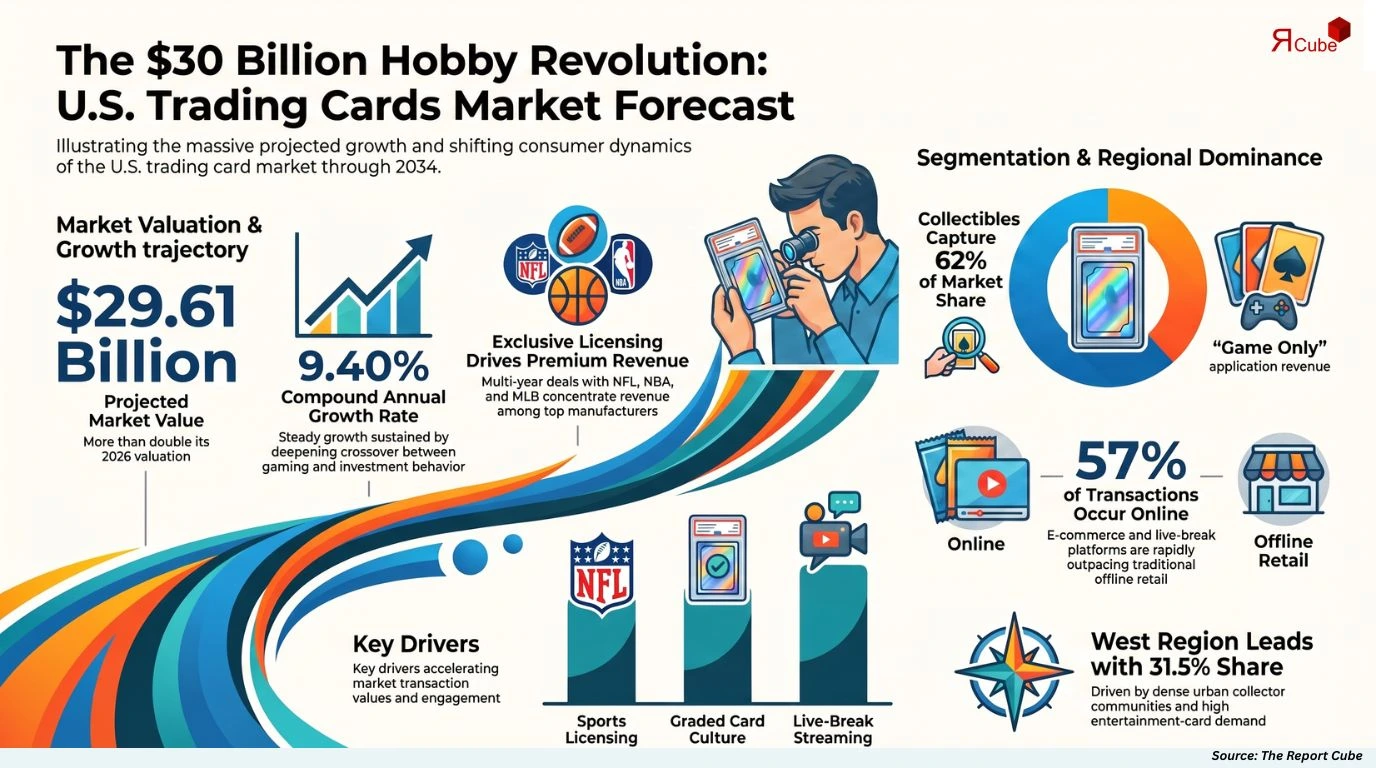
- Industry projected to reach USD 29.61 billion by 2034, expanding at a steady 9.40% CAGR.
- Collectible application segment dominates revenue contribution driven by intense hobbyist and investor participation.
- Online distribution channels are rapidly capturing market share through sealed product drops and auction platforms.
- The West region leads U.S. revenue generation supported by dense collector communities and established retail ecosystems.
- Panini America, Topps (Fanatics), Upper Deck, and Pokémon Company International anchor the competitive landscape nationally.
- Graded card investment culture and third-party authentication services are significantly elevating per-unit transaction values.
- Digital integration, NFT-linked physical cards, and live-break streaming formats continue reshaping collector engagement models.
U.S. Trading Cards Market Insights & Analysis
The U.S. Trading Cards Market is anticipated to register a 9.40% CAGR during 2026–2034. The market size was valued at USD 14.43 billion in 2026 and is projected to reach USD 29.61 billion by 2034. The market is benefiting from deepening crossover between gaming culture and collectible investment behavior, with younger demographics entering the hobby through platforms like eBay, COMC, and dedicated sports card marketplaces. Sustained licensing agreements between card manufacturers and major sports leagues, including the NFL, NBA, and MLB, continue anchoring premium product demand across the country.
Institutional interest in graded card assets has introduced a quasi-financial dimension to the hobby, with Professional Sports Authenticator (PSA) and Beckett Grading Services processing record submission volumes. Fanatics' acquisition of Topps and subsequent multi-sport licensing consolidation has intensified competition while encouraging innovation in exclusive parallel editions, autograph relics, and serialized short-print formats. These structural developments, combined with the expanding sports memorabilia and collectibles market, are expected to sustain revenue momentum well into the next decade.
U.S. Trading Cards Market Dynamics
Demand across the U.S. Trading Cards Market continues to strengthen as collectors, gamers, and investors converge on physical card products with demonstrable resale value and cultural relevance. Retail giants including Target and Walmart have reintroduced robust trading card floor space following the 2021–2022 supply shortage, while hobby-exclusive distributors and local card shops report sustained foot traffic. The convergence of pop culture licensing, competitive gaming, and alternative asset investment is creating durable long-term demand dynamics.
|
Factor |
Type |
Specific Impact on Market |
Magnitude |
|---|---|---|---|
|
Sports league licensing exclusivity |
Driver |
Concentrates premium product revenue among top manufacturers |
Very High |
|
Graded card investment culture |
Driver |
Elevates average transaction values and collector retention |
High |
|
Live-break streaming on social platforms |
Opportunity |
Expands retail reach and impulse purchasing behavior |
High |
|
Card counterfeiting and authenticity risks |
Challenge |
Increases dependence on third-party grading and authentication |
High |
|
NFT-linked physical card formats |
Trend |
Creates new revenue streams bridging digital and physical collecting |
Moderate |
Key Market Driver: Sports Licensing Exclusivity Fueling Premium Revenue
Exclusive multi-year licensing arrangements with the NFL, NBA, MLB, and NHL have become the single most decisive revenue driver across the U.S. Trading Cards Market. Fanatics' consolidation of Topps, combined with Panini America's ongoing NBA and NFL licenses, has structured the market around a small number of highly capitalized players capable of producing authenticated autograph relics, 1-of-1 superfractor parallels, and event-worn memorabilia cards. These exclusive formats regularly generate individual sale prices exceeding USD 10,000 at auction, directly compressing supply while amplifying per-unit value and collector demand intensity.
Major Industry Challenge: Counterfeiting and Authentication Pressure
The escalating value of rare and graded cards has attracted sophisticated counterfeit operations targeting vintage and modern key rookie cards alike. Third-party grading companies including PSA, BGS, and SGC have significantly extended turnaround times - sometimes exceeding six months - creating bottlenecks that delay market liquidity for sellers and investors. The proliferation of altered, trimmed, and recolored cards further undermines confidence among newer collectors, making robust authentication infrastructure a critical but capacity-constrained component of the broader trading card authentication and grading market ecosystem.
Emerging Trend Shaping Outlook: Live-Break Streaming and Social Commerce
Pack-breaking content on YouTube, Twitch, and dedicated platforms like Whatnot and BreakersTV has fundamentally altered how trading cards are discovered, purchased, and consumed. Live-break events enable national participation in geographically organized box breaks, generating immediate community engagement while driving real-time impulse purchasing at scale. Established manufacturers are increasingly co-producing exclusive break-format products with prominent online breakers, blurring the line between retail distribution and branded entertainment. This trend has particular resonance among the 18-to-34 demographic, which represents the fastest-growing collector cohort in the United States.
Need Specific Data, Let’s Customize the Report for You
Request CustomizationU.S. Trading Cards Market Segment-wise Analysis
The U.S. Trading Cards Market spans two primary end-use applications and two principal distribution channels, each exhibiting distinct revenue dynamics, growth trajectories, and consumer behavior patterns that inform competitive positioning across manufacturers and retailers.
By Application
- Game Only
- Collectible
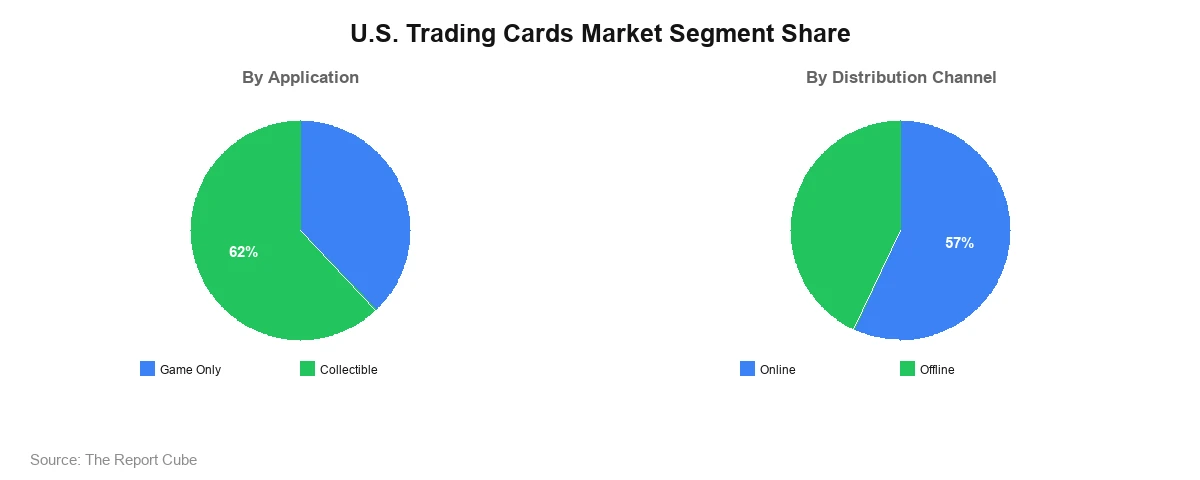
The Collectible segment commands the dominant share of the U.S. Trading Cards Market, accounting for approximately 62% of total market revenue in 2026. Collector-oriented products - spanning sports cards, Pokémon, Magic: The Gathering, and entertainment-licensed sets - generate substantially higher average transaction values than game-play formats due to parallel card hierarchies, autograph inclusions, and serial-numbered print runs. Sustained auction activity across eBay, PWCC Marketplace, and Heritage Auctions, alongside growing institutional interest in PSA 10-graded key rookies, continues reinforcing the segment's dominant revenue position.
The Game Only segment, while representing approximately 38% of market share, demonstrates robust and consistent demand anchored by organized competitive gaming ecosystems. Pokémon Trading Card Game, Magic: The Gathering, and sports simulation games sustain predictable retail sell-through as tournament participation grows. The Pokémon trading card game accessories market further expands spending per engaged player, supporting incremental revenue generation beyond core card purchases and positioning game-focused products for steady long-term volume growth.
By Distribution Channel
- Online
- Offline
The Online distribution channel has emerged as the leading revenue-generating channel, capturing an estimated 57% of the U.S. Trading Cards Market in 2026. E-commerce platforms including eBay, Amazon, COMC, and manufacturer-direct websites provide collectors and investors with instant access to sealed product, singles, and graded cards at national scale. The proliferation of live-break platforms such as Whatnot further accelerates online channel penetration, enabling real-time purchasing experiences that replicate and in some cases surpass the engagement of physical retail. Exclusive online product drops and limited hobby box releases available only through manufacturer websites consistently generate sell-out events within minutes of launch.
Offline channels, representing approximately 43% of market revenue, remain strategically important through hobby shops, big-box retailers, and card show events. Physical retail provides tactile product discovery, immediate access to single cards, and community gathering functions that online channels cannot fully replicate. The sports collectibles retail market continues expanding its physical footprint through specialty chain formats and pop-up card show circuits, reinforcing offline channel relevance particularly in the Midwest and South regions where established local hobby shop networks continue serving engaged collector communities.
Regional Projection of U.S. Trading Cards Market
Revenue distribution across the U.S. Trading Cards Market reflects regional variation driven by population density, sports fandom concentration, retail infrastructure maturity, and the density of established local hobby shop networks across the five major geographic regions.
|
Region |
Estimated Market Share |
Key Growth Factors |
Consumer Trends |
|---|---|---|---|
|
West |
31.5% |
Dense urban collector communities, strong e-commerce adoption |
High demand for Pokémon and entertainment cards |
|
East |
28.2% |
Major sports market concentration, strong grading submission activity |
Premium sports card and autograph relic demand |
|
South |
20.4% |
Expanding hobby shop networks, growing youth gaming participation |
Rising Pokémon and NFL card collecting activity |
|
Midwest |
14.6% |
Established local card show circuits, loyal sports collector base |
Strong baseball and football card demand |
|
Others |
5.3% |
Emerging collector communities in secondary markets |
Mixed sports and entertainment card growth |
- West: The West region leads the U.S. Trading Cards Market with approximately 31.5% revenue share, driven by California's outsized concentration of collectors, entertainment-licensed card demand, and robust online resale activity. Major metropolitan areas including Los Angeles and the San Francisco Bay Area host significant numbers of high-value collector transactions, while strong Pokémon and non-sports card demand adds breadth beyond traditional sports categories.
- East: The East region holds approximately 28.2% market share anchored by the New York, Boston, and Philadelphia sports markets, which sustain premium demand for Yankees, Red Sox, Patriots, and Knicks-related sports cards. Third-party grading submission volumes from the East rank among the highest nationally, reflecting deep investment-oriented collector activity and strong autograph relic purchasing behavior.
- South: The South represents a structurally expanding region as hobby shop openings accelerate across Texas, Florida, and Georgia markets. Growing youth participation in Pokémon organized play events and rising NFL card collecting, particularly around Dallas Cowboys and Tampa Bay Buccaneers products, are broadening the collector base across previously underpenetrated secondary markets throughout the region.
- Midwest: The Midwest maintains a loyal, established collector base centered on baseball and football card traditions, supported by active regional card show circuits in Chicago, Detroit, and Cleveland. Local hobby shops continue serving as community anchors for organized play and sealed product retail, sustaining consistent volume even as online channel penetration gradually increases across the region.
- Others: Smaller regional markets including the Mountain West and Pacific Northwest are generating emerging collector activity, particularly around entertainment-licensed and gaming card categories. Growing convention culture and the expansion of national card show events into secondary markets are progressively integrating these regions into the broader national trading card economy.
U.S. Trading Cards Market: Recent Development (2025)
- Fanatics Collectibles launched exclusive NFL rookie card series featuring multi-league authenticated autograph relics nationally.
- Pokémon Company International released the Stellar Crown expansion set, breaking hobby shop pre-order records across America.
- Panini America expanded its collegiate trading card licensing agreements, adding ten new NCAA programs for 2025.
- Upper Deck renewed its exclusive NHL trading card license, securing long-term product rights through the 2030 season.
U.S. Trading Cards Market Future Outlook (2034)
The U.S. Trading Cards Market is projected to expand at a 9.40% CAGR, reaching approximately USD 29.61 billion by 2034. Long-term growth will be sustained by deepening integration of grading technology, blockchain-verified card authentication, and direct-to-consumer licensing models that reduce distribution intermediaries while improving margin structures for manufacturers. The entry of younger collector cohorts - particularly Gen Z participants introduced to the hobby through Pokémon and entertainment-licensed products - ensures multi-decade demand continuity as these consumers mature into higher-spending collector and investor categories.
Technological advancement will reshape product architecture as manufacturers increasingly embed NFC chips, digital twin certificates, and augmented reality activations into physical card designs, creating hybrid experiences that bridge traditional collecting with digital ownership. The expansion of graded vintage baseball card investing alongside the continued growth of live-break commerce, collector-focused subscription boxes, and social-platform-native purchasing environments will support sustained revenue acceleration. Market consolidation around Fanatics, Panini, and Pokémon Company International is expected to intensify innovation investment while preserving category-level diversity across sports, gaming, and entertainment segments through 2034.
U.S. Trading Cards Market Report Coverage
|
Report Attribute |
Details |
|---|---|
|
Market Name |
U.S. Trading Cards Market |
|
Market Size (2026) |
USD 14.43 Billion |
|
Market Size (2034) |
USD 29.61 Billion |
|
Forecast Period |
2026–2034 |
|
CAGR |
9.40% |
|
Base Year |
2026 |
|
Historical Years |
2021–2025 |
|
Forecast Years |
2026–2034 |
|
Segments Covered |
By Application, By Distribution Channel, By Card Type |
|
Regions Covered |
West, East, South, Midwest, Others |
|
Key Companies |
Panini America, Topps (Fanatics), Upper Deck, Pokémon Company International, Leaf Trading Cards, Others |
|
Report Format |
PDF, Excel, PPT |
|
Customization |
Available as per client requirements |
Why Choose This Report?
- Comprehensive analysis covering collector, investor, and gaming demand dynamics.
- Accurate market sizing with reliable revenue forecast through 2034.
- Detailed segmentation by application and distribution channel with share data.
- Regional insights covering all five U.S. geographic markets with growth factors.
- Competitive profiling of leading manufacturers and licensing incumbents nationally.
- Analysis of grading culture, authentication infrastructure, and live-break trends.
- Recent 2025 corporate developments from key players across the industry.
- Strategic insights supporting investment, licensing, and market entry decisions.
Table of Contents
- Introduction
- Objective of the Study
- Product Definition
- Market Segmentation
- Study Variables
- Research Methodology
- Secondary Data Points
- Companies Interviewed
- Primary Data Points
- Breakdown of Primary Interviews
- Secondary Data Points
- Executive Summary
- Market Dynamics
- Drivers
- Challenges
- Opportunity Assessment
- Recent Trends and Developments
- Policy and Regulatory Landscape
- U.S. Trading Cards Market Overview and Forecast Analysis (2021-2034)
- Market Size, By Value, By Growth Rate (CAGR/USD Billions)
- Demand – Supply Trends
- Market Share, By Card Type
- Sports Cards
- Non-Sports Cards
- Market Share, By Application
- Game Only
- Collectible
- Market Share, By Distribution Channel
- Online
- Offline
- Market Share, By Region
- West
- East
- South
- Midwest
- Others
- Market Share, By Competitors
- Competition Characteristics
- Revenue Shares
- Sports Cards U.S. Trading Cards Market Overview, 2021-2034F
- By Value (USD Million)
- By Application – Market Size & Forecast 2021-2034, USD Million
- Game Only
- Collectible
- Non-Sports Cards U.S. Trading Cards Market Overview, 2021-2034F
- By Value (USD Million)
- By Application – Market Size & Forecast 2021-2034, USD Million
- Game Only
- Collectible
- Competitive Outlook (Company Profile – Partial List)
- Panini America
- Company Overview
- Business Segments
- Strategic Alliances/Partnerships
- Recent Developments
- Topps (Fanatics)
- Company Overview
- Business Segments
- Strategic Alliances/Partnerships
- Recent Developments
- Upper Deck
- Company Overview
- Business Segments
- Strategic Alliances/Partnerships
- Recent Developments
- Pokémon Company International
- Company Overview
- Business Segments
- Strategic Alliances/Partnerships
- Recent Developments
- Leaf Trading Cards
- Company Overview
- Business Segments
- Strategic Alliances/Partnerships
- Recent Developments
- Others
- Panini America
- Contact Us & Disclaimer
Top Key Players & Market Share Outlook
- Panini America
- Topps (Fanatics)
- Upper Deck
- Pokémon Company International
- Leaf Trading Cards
- Others
Frequently Asked Questions