



Build Your Custom Market Intelligence Report
Customize Your ReportKey Takeaways
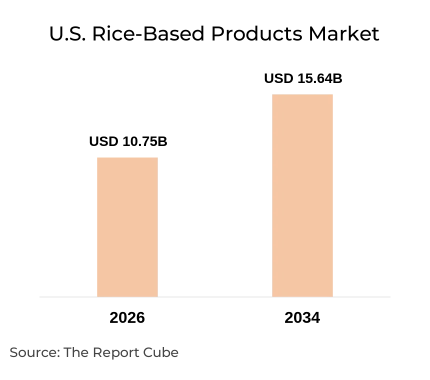
- U.S. Rice-Based Products Market is valued at USD 10.75 billion in 2026.
- The market is projected to reach USD 15.64 billion by 2034 at a CAGR of 4.80%.
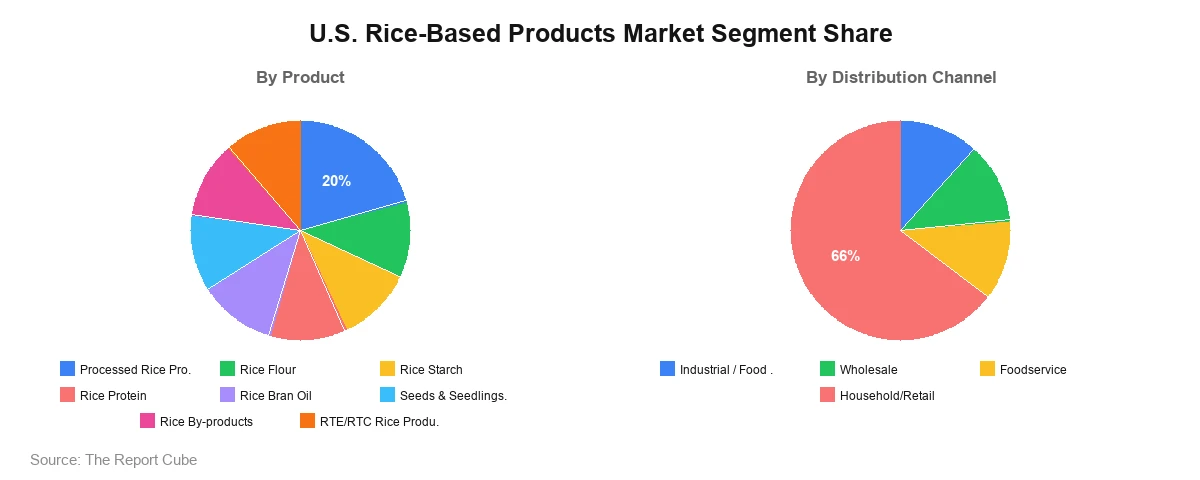
- Processed rice products lead the product segment with an estimated 20% share in 2026.
- Household/retail leads the distribution channel segment with an estimated 66% share in 2026.
- West leads the regional landscape with an estimated 25% share in 2026.
- Lundberg Family Farms, ADM, Kellanova, The Quaker Oats and CJ CheilJedang are among the key players.
- Value recovery from milling co-products and value-added rice formats are important themes in USDA analysis.
Market Overview
Rice-based products include foods and ingredients made from rice, such as processed rice products, rice flour, rice starch, rice protein, rice bran oil, seeds and seedlings, by-products, and ready-to-eat or ready-to-cook items. They mainly serve household consumption, food processing, foodservice, and industrial applications, including processed foods, beer, and pet food.
The U.S. Rice-Based Products Market Analysis indicates demand supported by established use of rice in value-added foods. According to the USDA Economic Research Service, processed foods such as flavored rice mixes, cereals, and rice cakes accounted for around 13% of domestic rice use in its cited historical analysis, reflecting long-standing demand for packaged formats.
Market participants use rice-based products across packaged foods, ingredients, and industrial applications. USDA identifies gluten-free demand and new rice-based product introductions as contributors to long-term domestic rice use. The U.S. market is valued at USD 10.75 billion in 2026 and is projected to grow at a CAGR of 4.80% during 2026–2034.
U.S. Rice-Based Products Market Dynamics
Demand for rice-based products is shaped by use in processed foods and industrial applications, while supply and pricing depend on crop yields, weather, input costs, and international trade. Competition includes agricultural processors, branded food manufacturers, and specialty producers. The assessment below draws on USDA analysis.
|
Factor |
Type |
Specific Impact on Market |
Magnitude |
|---|---|---|---|
|
Use in processed foods |
Driver |
USDA cites around 13% of historical domestic rice use in flavored mixes, cereals and rice cakes, supporting packaged formats |
Medium (qualitative) |
|
Multiple end uses |
Driver |
Direct consumption, processed foods, beer and pet food widen the demand base |
Medium (qualitative) |
|
Milling co-product recovery |
Opportunity |
Bran, oil, flour and hulls can be developed into additional food ingredients |
Medium (qualitative) |
|
Weather and input costs |
Challenge |
Drought, flooding and rising input prices can affect crop availability and processor costs |
Medium–High (qualitative) |
|
Import dependence |
Challenge |
Imports averaged over 14% of rice supply since 2019/20, exposing some users to trade changes |
Medium (qualitative) |
|
Value-added product development |
Trend |
Gluten-free demand and new rice-based products support diversification |
Medium (qualitative) |
U.S. Rice-Based Products Market Growth Drivers
U.S. Rice-Based Products Market Growth is supported by the range of end uses for rice. USDA identifies direct human consumption, processed foods, beer, and pet food among domestic applications, which gives processors several potential outlets and reduces reliance on a single product format. The source does not quantify each application’s revenue contribution to the supplied forecast.
Processed rice products lead the product mix at 20% in 2026, and household and retail channels account for 66% of the supplied distribution split. These supplied figures indicate that household and retail consumption forms the largest channel, while industrial, wholesale, and foodservice channels contribute the remaining share of the market.
U.S. Rice-Based Products Market Opportunities
USDA research identifies rice bran, rice oil, rice flour, rice hulls, and other milling co-products as potential food ingredient sources. Processors can evaluate recovery and processing methods that create additional applications, subject to technical feasibility, food-safety requirements, and commercial demand. This opportunity is qualitative and is not a quantified revenue forecast.
Manufacturers can assess new packaged rice meals, mixes, flours, and other ingredients that meet specific food-processing requirements. USDA documents the use of rice in processed foods and links gluten-free demand and new product introductions to long-term domestic rice use, although category-level growth rates for rice protein or rice starch are not established.
U.S. Rice-Based Products Industry Challenges
USDA research identifies drought, flooding, rising input prices, and export competition among the challenges affecting U.S. rice farming. These conditions can influence crop availability and input costs for processors and downstream manufacturers, although the effect on rice-based products varies by product category and sourcing arrangements, and the source does not quantify it.
USDA reports that the United States has imported, on average, more than 14% of its total rice supply since 2019/20 in the cited historical analysis. Imported rice therefore forms a meaningful part of domestic supply, and changes in international availability, prices, or trade conditions can affect some processors and downstream users.
Need Specific Data, Let’s Customize the Report for You
Request CustomizationU.S. Rice-Based Products Market Trends
U.S. Rice-Based Products Market Trends include the use of rice-derived materials beyond whole-kernel rice. USDA documents that milling yields rice bran, hulls, and broken kernels with different food, feed, and industrial uses. This illustrates the importance of value recovery from milling and the range of derivative products available to processors.
Value-added rice product development is a documented long-term pattern. USDA identifies gluten-free demand and the introduction of new rice-based products among factors contributing to growth in domestic rice use. This provides historical evidence for diversification into processed products, although it does not establish current growth rates for categories such as rice protein or rice starch.
U.S. Rice-Based Products Market Segment Analysis
The market is segmented by product and distribution channel, reflecting differences in processing requirements, end-use applications, and purchasing patterns. Estimated 2026 shares are shown only for the leading segment in each category, based on supplied figures.
By Product
- Processed Rice Products
- Rice Flour
- Rice Starch
- Rice Protein
- Rice Bran Oil
- Seeds & Seedlings
- Rice By-products
- RTE/RTC Rice Products
U.S. Rice-Based Products Market Share is led by processed rice products, which hold an estimated 20% in 2026, supported by the established use of rice in flavored mixes, cereals, and rice cakes. Lundberg Family Farms, Kellanova, and The Quaker Oats are among the companies active in packaged rice-based foods. Rice flour and rice starch follow, serving food-processing and ingredient applications, while rice protein and rice bran oil draw on milling co-products that USDA identifies as potential food ingredient sources. Seeds and seedlings form the agricultural base of the value chain, and rice by-products reflect value recovery from bran, hulls, and broken kernels. RTE/RTC rice products address convenience-oriented meal formats. Growth across these categories depends on processor investment, crop availability, and demand for gluten-free and value-added formats, although category-level growth rates are not established in the supplied data.
By Distribution Channel
- Industrial / Food Processing
- Wholesale
- Foodservice
- Household/Retail
Household/retail leads the distribution channel segment with an estimated 66% share in 2026, reflecting consumer purchases of packaged rice, rice cakes, snacks, and ready-to-eat formats through retail outlets, with Lundberg Family Farms, The Quaker Oats, and Element Snacks present in these formats. Industrial/food processing follows as manufacturers use rice flour, starch, bran, and other derivatives in processed foods and related applications. Wholesale supports bulk distribution to commercial users, while foodservice covers restaurants and institutional kitchens that use rice-based ingredients and prepared items. Channel demand depends on retail availability, processing requirements, ingredient costs, and the pace of new product introductions. The supplied data do not identify the fastest-growing channel, so no growth ranking is assigned.
Regional Analysis
The U.S. Rice-Based Products Market is assessed across West, Southwest, North, and Midwest. Only the leading region’s share was supplied.
|
Region |
Estimated Market Share |
Key Growth Factors |
Industry Trends |
|---|---|---|---|
|
West |
25% |
California rice production and brands, including Lundberg Family Farms |
Expansion of Regenerative Organic Certified rice across packaged products |
|
Southwest |
- |
Requires verification |
- |
|
North |
- |
Requires verification |
- |
|
Midwest |
- |
Requires verification |
- |
West is the leading region with an estimated 25% share in 2026. The region includes California, where Lundberg Family Farms is headquartered and where the company has expanded Regenerative Organic Certified rice across more than 70 products. The 25% figure is the supplied estimate for the region and should be validated before publication.
Southwest, North, and Midwest shares were not supplied, and the remaining 75% of the U.S. Rice-Based Products Market is therefore not allocated among them. Regional demand patterns, infrastructure, and applicable regulations for these areas require verification before publication, because allocating shares without supporting data would reduce the reliability and credibility of the regional analysis.
Market Share & Competitive Landscape
The U.S. Rice-Based Products Market includes agricultural processors, branded food manufacturers, and specialty snack producers. The table summarizes the supplied companies by general capability and relevant segment. It does not represent numerical market share, and company-level sales in the United States require validation.
|
Company |
Competitive Strength |
Primary Segment Served |
|---|---|---|
|
Lundberg Family Farms |
Regenerative Organic Certified rice and rice-based products, including rice cakes and chips |
Household/retail; processed rice products |
|
ADM |
Large-scale agricultural processing and ingredient supply; rice-specific activity requires validation |
Industrial / food processing |
|
SWAD |
Supplied company; product scope requires validation |
Requires validation |
|
Delice Global Inc. |
Supplied company; product scope requires validation |
Requires validation |
|
Kellanova |
Branded snack portfolio including Rice Krispies Treats; now part of Mars |
Household/retail; processed rice products |
|
The Quaker Oats |
Branded packaged foods, including rice-based snacks |
Household/retail |
|
Grainwell Puffed Grains |
Puffed grain products; product scope requires validation |
Household/retail; snack formats |
|
Element Snacks |
Rice cake snack products |
Household/retail |
|
CJ CheilJedang Corporation |
Packaged food and ingredient portfolio; U.S. rice-related activity requires validation |
Processed rice products; RTE/RTC rice products |
Key Companies in the U.S. Rice-Based Products Market
Lundberg Family Farms: Lundberg Family Farms is headquartered in Richvale, California, and has produced rice since the 1960s. In January 2026, the company launched Sweet Cakes, a line of dessert-inspired mini rice cakes. Its competitive strength lies in Regenerative Organic Certified rice and a portfolio of more than 70 certified products.
Kellanova: Kellanova is headquartered in Chicago, Illinois, and became an independent snacking company in 2023 after separating from its North American cereal business. Mars completed its acquisition on December 12, 2025, placing brands including Rice Krispies Treats under Mars Snacking. Its strength lies in established snack brands and national retail distribution.
Recent Developments
|
Year / Month |
Company |
Development |
|---|---|---|
|
December 2025 |
Mars, Incorporated / Kellanova |
Mars completed the Kellanova acquisition after receiving all required regulatory approvals by December 8, 2025. |
|
January 2026 |
Lundberg Family Farms |
Lundberg launched Sweet Cakes mini rice cakes in Birthday Cake, Apple Pie, and Salted Caramel flavors at Sprouts nationwide. |
|
August 2026 |
Lundberg Family Farms |
A voluntary recall of 27,324 two-pound bags of Regenerative Organic Certified White Jasmine Rice for possible foreign material was reported as updated by the FDA. |
U.S. Rice-Based Products Market Future Outlook
The U.S. Rice-Based Products Market Forecast indicates expansion from USD 10.75 billion in 2026 to USD 15.64 billion by 2034 at a CAGR of 4.80%, based on supplied estimates. Growth is expected to depend on retail demand, processed-food applications, ingredient development, and the recovery of value from milling co-products, which USDA identifies as potential ingredient sources for processors and manufacturers.
Risks include weather-related crop disruption, rising input prices, export competition, and exposure to imported supply, all identified in USDA analysis. Competitive conditions may also change as ownership shifts, such as Mars completing its Kellanova acquisition in December 2025. The projected values remain supplied assumptions, and actual outcomes will depend on supply conditions, regulation, product innovation, and consumer demand patterns during the forecast period.
U.S. Rice-Based Products Market Report Coverage
This U.S. Rice-Based Products Market Report summarizes the supplied valuation, forecast assumptions, segmentation, regional framework, and competitive set.
|
Parameter |
Details |
|---|---|
|
Market Name |
U.S. Rice-Based Products Market |
|
Market Size 2026 |
USD 10.75 billion |
|
Market Size 2034 |
USD 15.64 billion |
|
Forecast Period |
2026–2034 |
|
CAGR |
4.80% |
|
Base Year |
2026 |
|
Historical Years |
2021-2025 |
|
Forecast Years |
2026–2034 |
|
Segments Covered |
By Product; By Distribution Channel |
|
Regions Covered |
West, Southwest, North, Midwest |
|
Key Companies |
Lundberg Family Farms, ADM, SWAD, Delice Global Inc., Kellanova, The Quaker Oats, Grainwell Puffed Grains, Element Snacks, CJ CheilJedang Corporation |
|
Customization |
Available as per client requirements |
Why Choose This U.S. Rice-Based Products Market Report?
- Market scope covering processed rice products, ingredients, by-products, and ready-to-eat formats across U.S. channels.
- Clear presentation of the supplied 2026 valuation, 2034 forecast, and 4.80% CAGR.
- Segmentation across eight product categories and four distribution channels.
- Regional framework covering West, Southwest, North, and Midwest.
- Competitive profiling of nine supplied rice, grain, ingredient, and packaged food companies.
- Trend and opportunity insights based on USDA analysis of rice use, milling co-products, and supply conditions.
- Forecast context to support product planning, sourcing strategy, and market-entry evaluation.
Table of Contents
- Introduction
- Objective of the Study
- Product Definition
- Market Segmentation
- Study Variables
- Research Methodology
- Secondary Data Points
- Companies Interviewed
- Primary Data Points
- Breakdown of Primary Interviews
- Secondary Data Points
- Executive Summary
- Market Dynamics
- Drivers
- Challenges
- Opportunity Assessment
- Recent Trends and Developments
- Policy and Regulatory Landscape
- U.S. Rice-Based Products Market Overview and Forecast Analysis (2021-2034)
- Market Size, By Value, By Growth Rate (CAGR/USD Billions)
- Demand – Supply Trends
- Market Share, By Product
- Processed Rice Products
- Rice Flour
- Rice Starch
- Rice Protein
- Rice Bran Oil
- Seeds & Seedlings
- Rice By-products
- RTE/RTC Rice Products
- Market Share, By Distribution Channel
- Industrial / Food Processing
- Wholesale
- Foodservice
- Household/Retail
- Market Share, By Region
- West
- Southwest
- North
- Midwest
- Market Share, By Competitors
- Competition Characteristics
- Revenue Shares
- Processed Rice Products U.S. Rice-Based Products Market Overview, 2021-2034F
- By Value (USD Million)
- By Distribution Channel – Market Size & Forecast 2021-2034, USD Million
- Industrial / Food Processing
- Wholesale
- Foodservice
- Household/Retail
- Rice Flour U.S. Rice-Based Products Market Overview, 2021-2034F
- By Value (USD Million)
- By Distribution Channel – Market Size & Forecast 2021-2034, USD Million
- Industrial / Food Processing
- Wholesale
- Foodservice
- Household/Retail
- Rice Starch U.S. Rice-Based Products Market Overview, 2021-2034F
- By Value (USD Million)
- By Distribution Channel – Market Size & Forecast 2021-2034, USD Million
- Industrial / Food Processing
- Wholesale
- Foodservice
- Household/Retail
- Rice Protein U.S. Rice-Based Products Market Overview, 2021-2034F
- By Value (USD Million)
- By Distribution Channel – Market Size & Forecast 2021-2034, USD Million
- Industrial / Food Processing
- Wholesale
- Foodservice
- Household/Retail
- Rice Bran Oil U.S. Rice-Based Products Market Overview, 2021-2034F
- By Value (USD Million)
- By Distribution Channel – Market Size & Forecast 2021-2034, USD Million
- Industrial / Food Processing
- Wholesale
- Foodservice
- Household/Retail
- Seeds & Seedlings U.S. Rice-Based Products Market Overview, 2021-2034F
- By Value (USD Million)
- By Distribution Channel – Market Size & Forecast 2021-2034, USD Million
- Industrial / Food Processing
- Wholesale
- Foodservice
- Household/Retail
- Rice By-products U.S. Rice-Based Products Market Overview, 2021-2034F
- By Value (USD Million)
- By Distribution Channel – Market Size & Forecast 2021-2034, USD Million
- Industrial / Food Processing
- Wholesale
- Foodservice
- Household/Retail
- RTE/RTC Rice Products U.S. Rice-Based Products Market Overview, 2021-2034F
- By Value (USD Million)
- By Distribution Channel – Market Size & Forecast 2021-2034, USD Million
- Industrial / Food Processing
- Wholesale
- Foodservice
- Household/Retail
- Competitive Outlook (Company Profile – Partial List)
- Lundberg Family Farms
- Company Overview
- Business Segments
- Strategic Alliances/Partnerships
- Recent Developments
- ADM
- Company Overview
- Business Segments
- Strategic Alliances/Partnerships
- Recent Developments
- SWAD
- Company Overview
- Business Segments
- Strategic Alliances/Partnerships
- Recent Developments
- Delice Global Inc.
- Company Overview
- Business Segments
- Strategic Alliances/Partnerships
- Recent Developments
- Kellanova
- Company Overview
- Business Segments
- Strategic Alliances/Partnerships
- Recent Developments
- The Quaker Oats
- Company Overview
- Business Segments
- Strategic Alliances/Partnerships
- Recent Developments
- Grainwell Puffed Grains
- Company Overview
- Business Segments
- Strategic Alliances/Partnerships
- Recent Developments
- Element Snacks
- Company Overview
- Business Segments
- Strategic Alliances/Partnerships
- Recent Developments
- CJ CheilJedang Corporation
- Company Overview
- Business Segments
- Strategic Alliances/Partnerships
- Recent Developments
- Lundberg Family Farms
- Contact Us & Disclaimer
Top Key Players & Market Share Outlook
- Lundberg Family Farms
- ADM
- SWAD
- Delice Global Inc.
- Kellanova
- The Quaker Oats
- Grainwell Puffed Grains
- Element Snacks
- CJ CheilJedang Corporation
Frequently Asked Questions